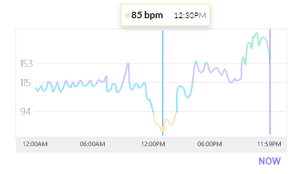
Heart Rate Analysis is a feature within the Activity Center that lets users view their daily heart rate in a graphical format. The analysis shows the current heart rate in BPM (beats per minute), a line graph that shows data of the heart beat fluctuation over the last 24 hours, and three zones of heart rate levels (Low, Moderate, and High).
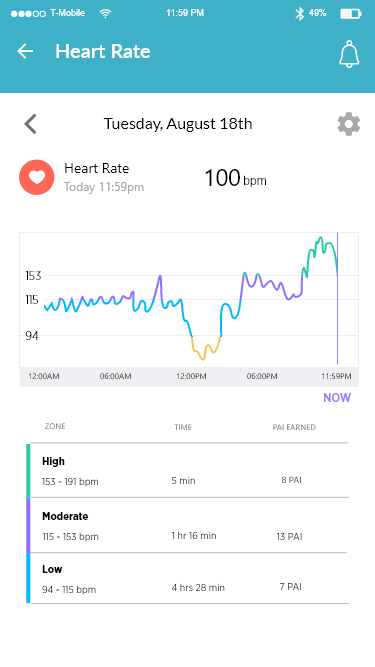
Heart Rate Graph
Compared to previous iterations of this display, HR Analysis now has the color-coded HR zones along with the tooltip interactions. The details even go as to show the amount of time spent in each heart rate zone, as well as the amount of PAI earned (Personal Activity Intelligence). PAI is a scientifically-backed algorithm & feature that uses fitness metrics to keep track of a user’s health and motivates them to accomplish more.
Low HR Zone
Moderate HR Zone
High HR Zone
Sleeping HR
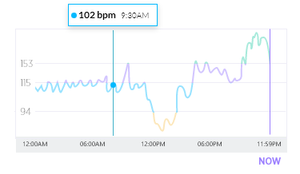
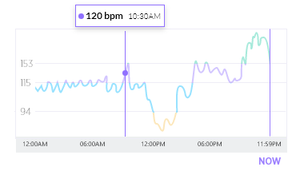
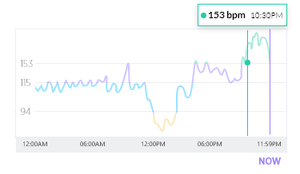
🔍 The graph features a Tap & Hold tool-tip that allows users to pinpoint an exact time and view the heart rate for that precise minute. The interaction also works as a ‘drag’ feature, where the user can simply scroll their finger through the graph to view timestamps. This exact user interaction was also made consistent with the Sleep Analysis graphical interface as well.